Development of a National Statistics Indicators Dashboard
Statistics — 2025, Undergraduate
official statisticsdata dashboardSustainable Development Goalsindicators
This study developed a national statistics indicators dashboard that visualises official indicators across sectors such as education, health, and the economy. The dashboard allows users to compare disaggregations over time and export indicator summaries for reporting. Adopting a client-server architecture and a survey-based usability evaluation, the system was built using JavaScript, React, D3.js, and PostgreSQL. The findings showed that the dashboard improved accessibility and comprehension of official statistics for planners and the public, while achieving a high System Usability Scale score. The study recommends alignment with Sustainable Development Goal indicator frameworks.
Ad slot
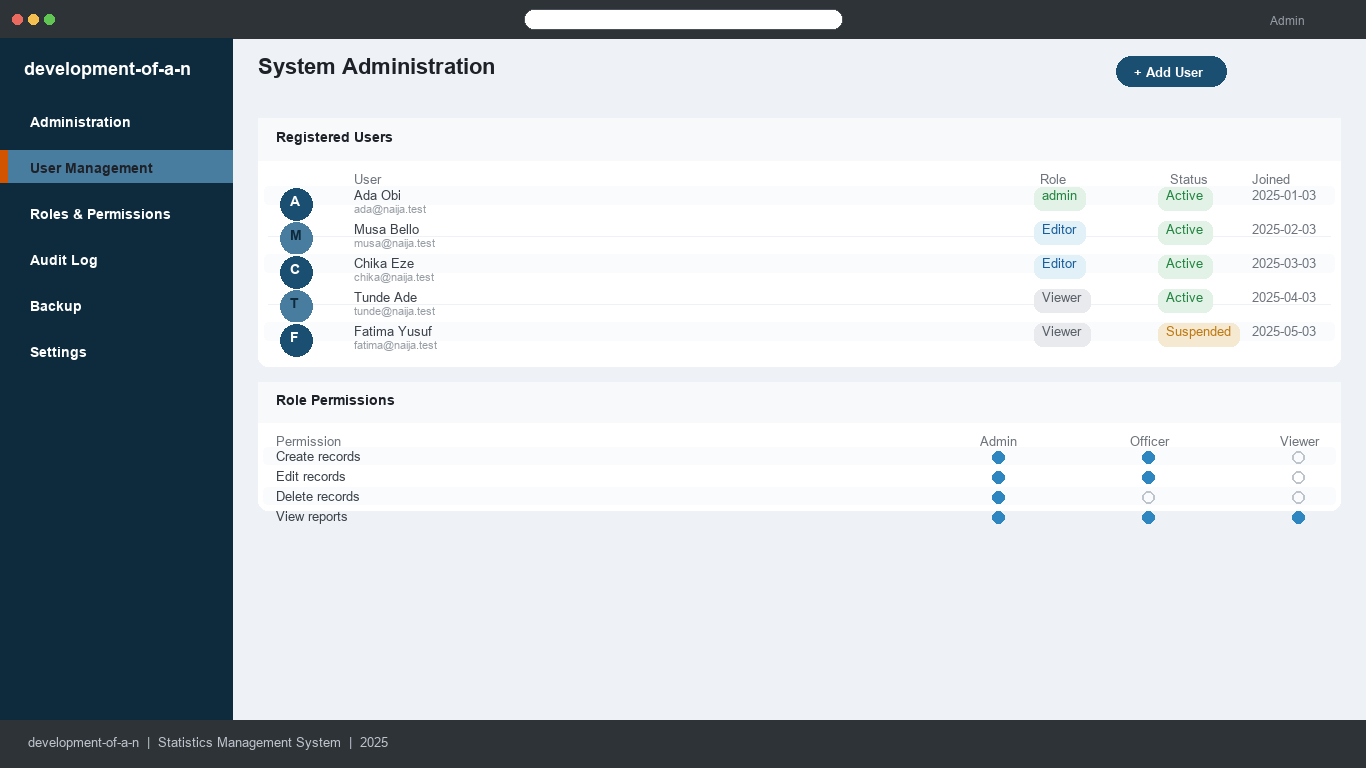
Homepage screenshot