Development of an Interactive Data Visualization Dashboard for Survey Data
Statistics — 2025, Undergraduate
web applicationsurvey datadata visualizationdashboard
This study developed an interactive data visualization dashboard for exploring survey data collected within Nigerian institutions. The platform enables users to upload survey responses, filter by demographics, and view bar charts, pie charts, and heatmaps dynamically. Adopting a client-server architecture and a survey-based usability evaluation, the system was built using JavaScript, D3.js, Node.js, and MongoDB. The findings showed that the dashboard improved data comprehension and supported faster insight generation compared with static reports, while achieving a high System Usability Scale score. The study recommends scaling the dashboard for larger datasets and organisational use.
Ad slot
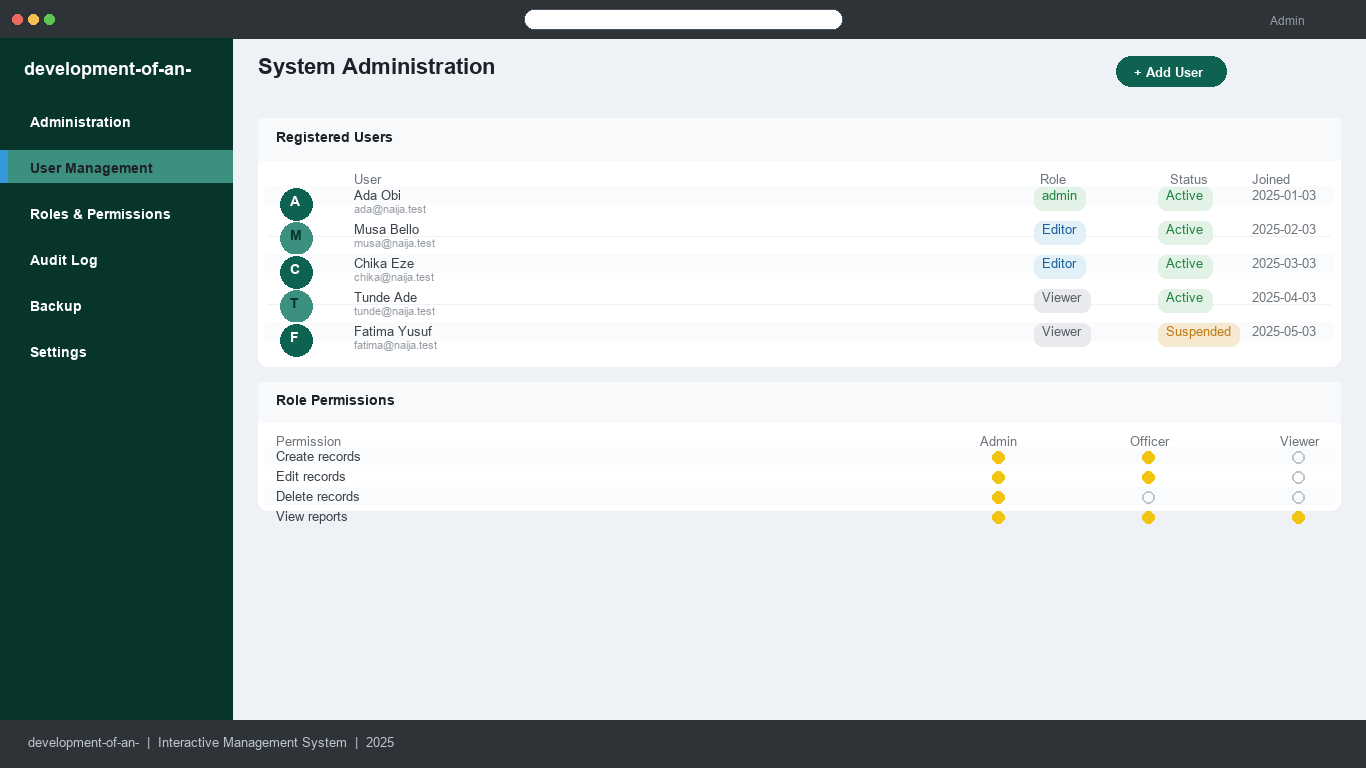
Homepage screenshot